
Hands-on Lab: Statistical Analysis using Excel
Data:
Use the provided file - sales.xlsx
Hold the CTRL key while you click to download the file:
Software: MS Excel
Duration: 1 hr
Tasks:
1. Conduct Regression Analysis
Perform regression analysis on a subset of data due to Excel's limitations with large datasets.
- Select any set of 20,000 rows from the dataset.
- Utilize Excel's Analysis ToolPak for regression analysis of Sales over Date.
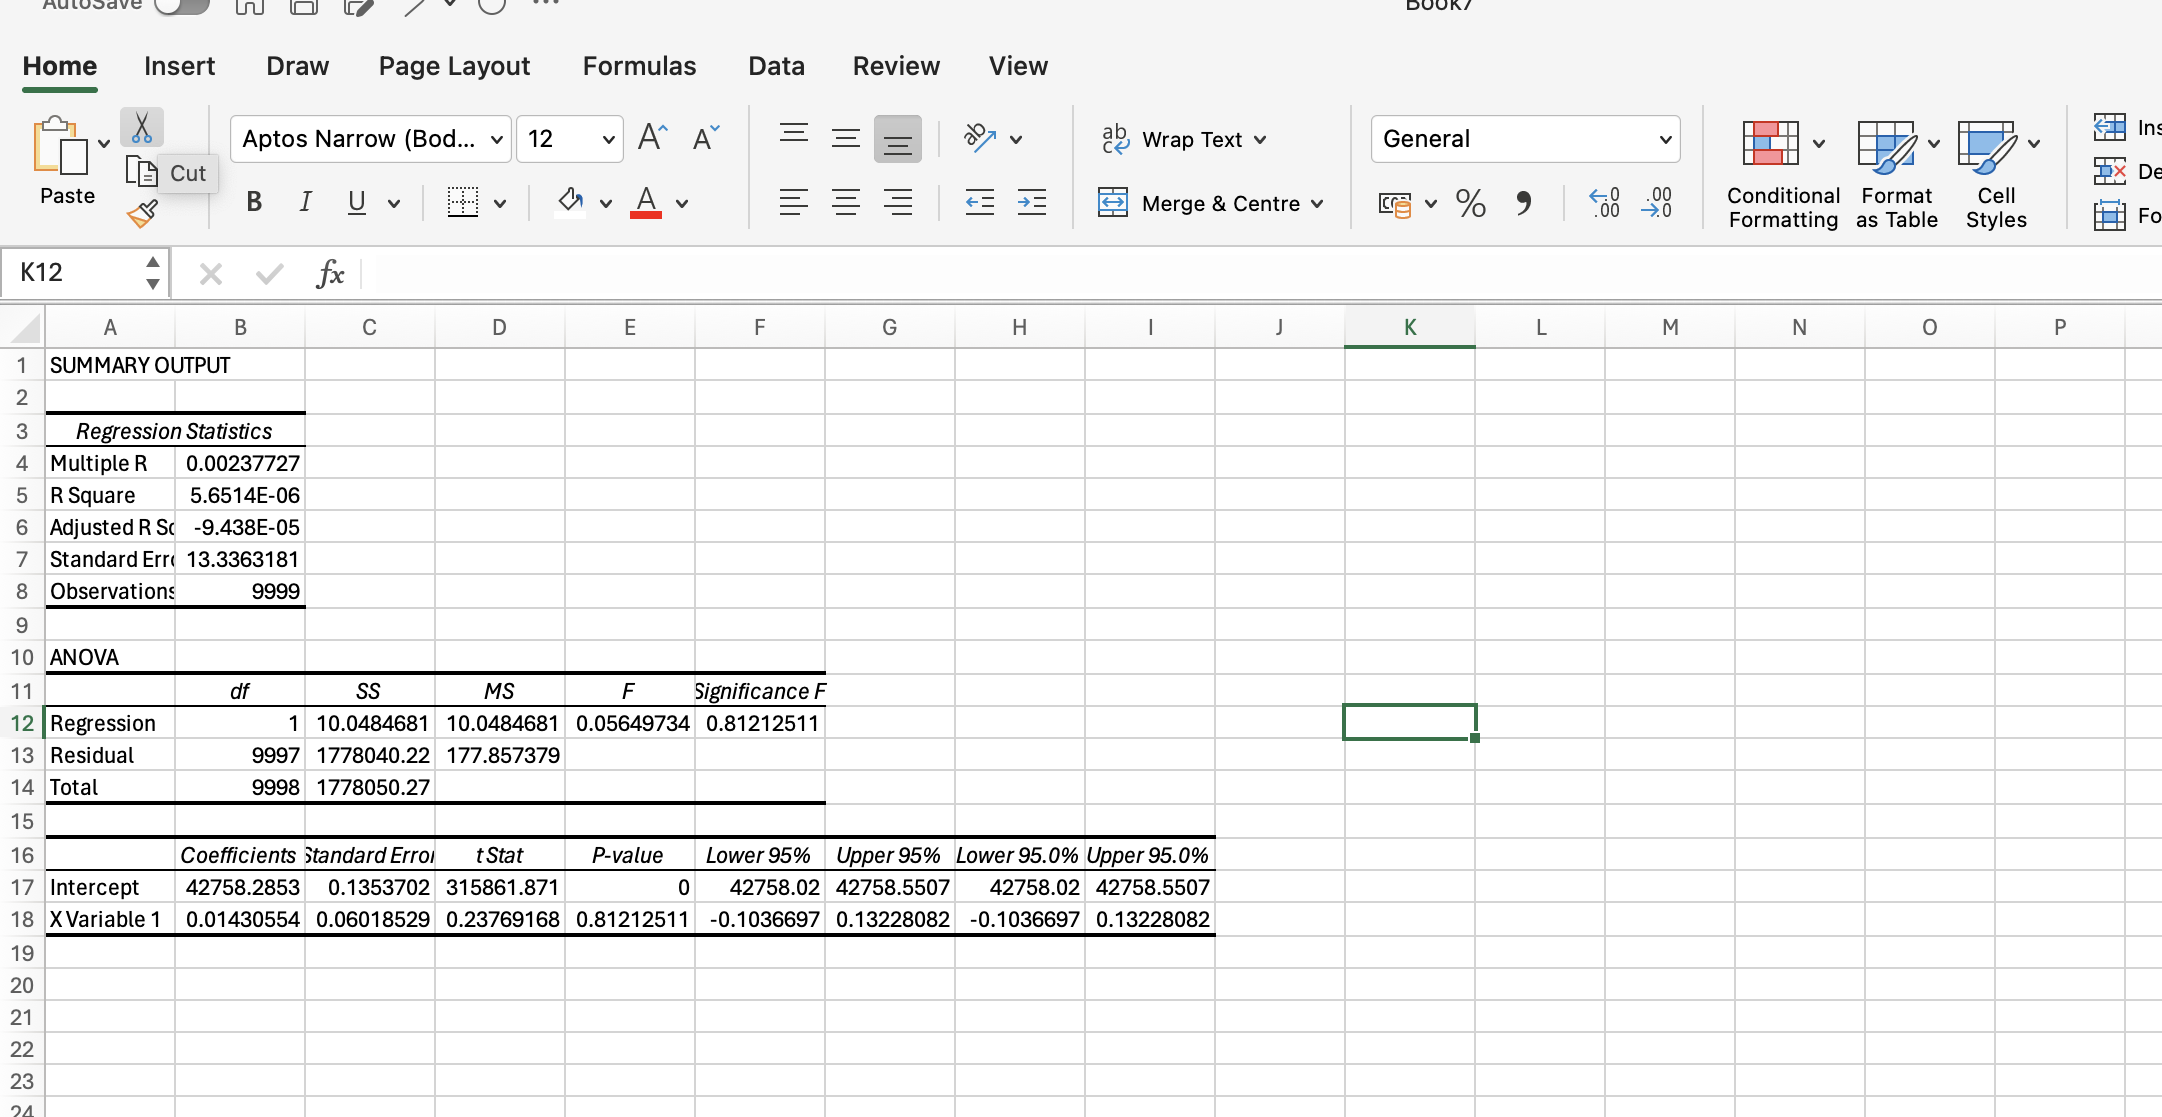
2. Interpret the Regression Statistics
Analyze the regression statistics, emphasizing the following:
- Interpret coefficients to explain the expected sales change with a one-unit increase in the independent variable.
- Assess significance levels (p-values) to determine the statistical significance of independent variables.
- Evaluate the R-squared value to grasp the proportion of variance in sales predictable from the independent variables.
Hint: Sample output
3. Use of Regression Analysis
- Utilize the regression equation to estimate future sales based on date and other independent variables.
4. Take Screenshots
- Ensure you have taken a screenshot after each task, as you'll be required to add them to your final presentation.
Note
As you finalize your tasks in this statistical analysis lab using Excel, remember to capture screenshots of your regression analysis output. Your critical analysis and interpretation of the regression statistics are key components of this exercise. These visuals and insights will form an essential part of your report, which you need to submit in your final PowerPoint presentation.
Congratulations! You have completed this lab and are ready for the next topic.
Author(s)
Deepa
Other Contributor(s)
Shubhra Das